Manual


Enhanced van Holde - Weischet Data Analysis:

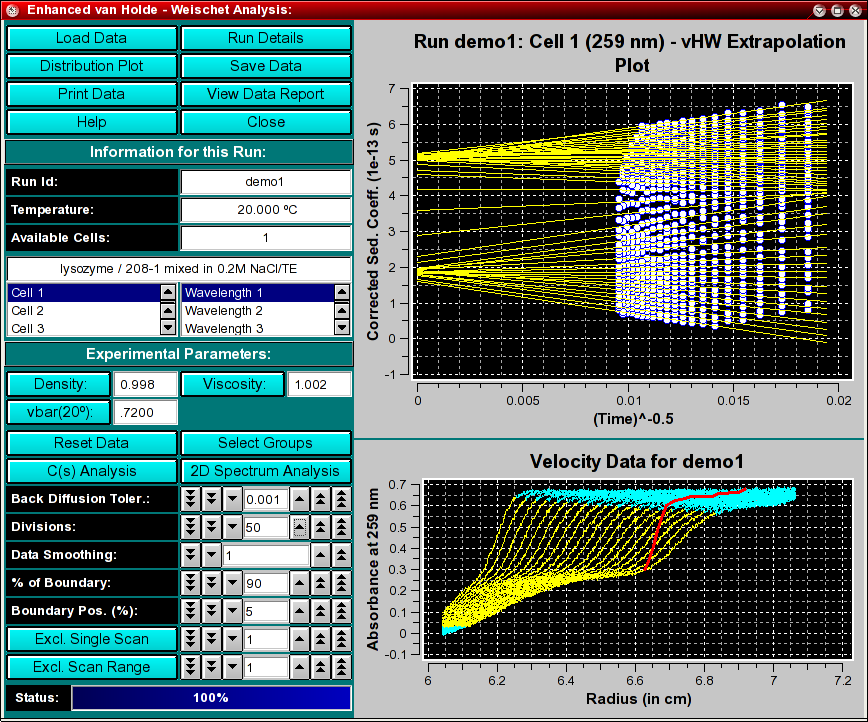
The enhanced van Holde - Weischet analysis is a model independent method to analyze velocity data. It will provide S-value distributions that are corrected for diffusion effects, and provide valuable diagnostics for velocity data. Compared to the traditional van Holde - Weischet method there are several improvements in the enhanced method which allow it to better deal with heterogeneous samples and samples that contain two or more well-separated components. The enhanced method also can take advantage of data points near the bottom of the cell and from scans that have no longer a stable plateau or have not yet cleared the meniscus.

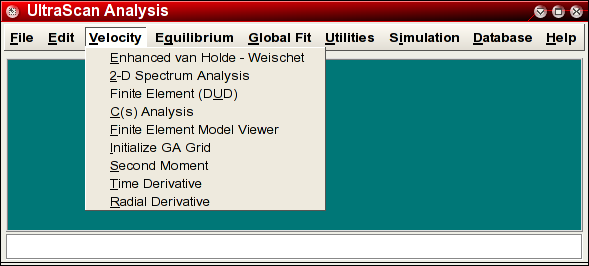
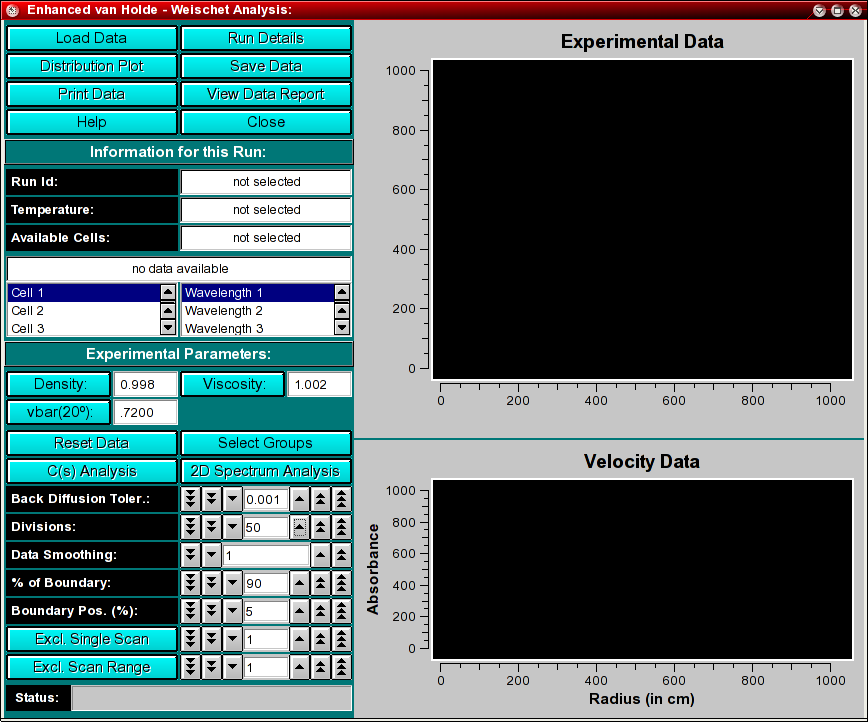
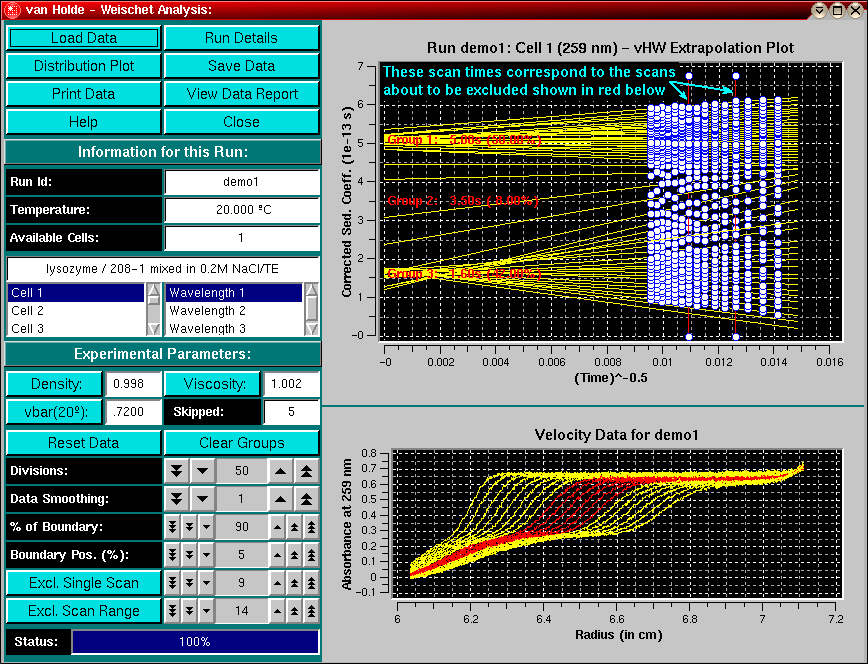
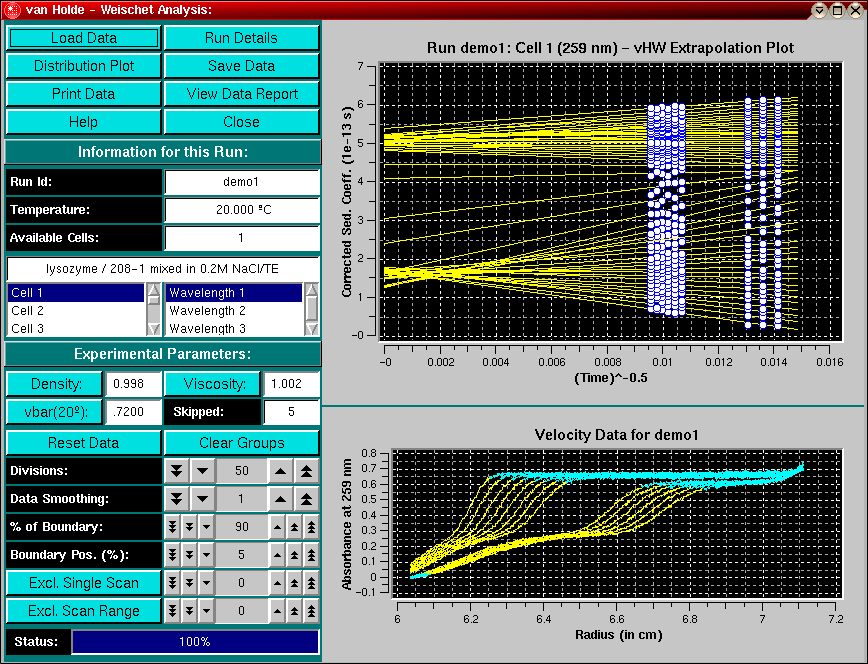
You start the enhanced van Holde - Weischet data analysis by clicking on "Enhanced van Holde - Weischet" in the Velocity sub-menu of the main menu. The main Enhanced van Holde - Weischet data analysis window will appear.

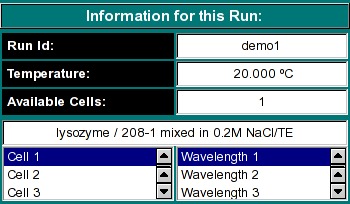
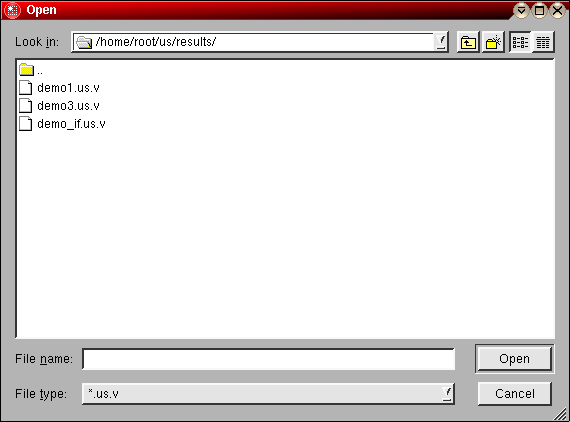
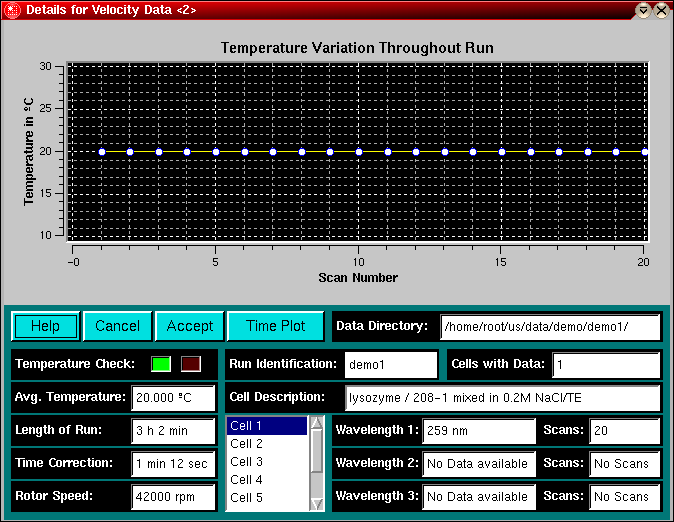
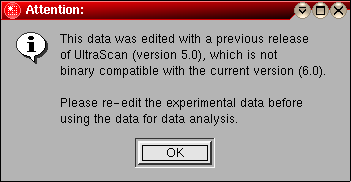
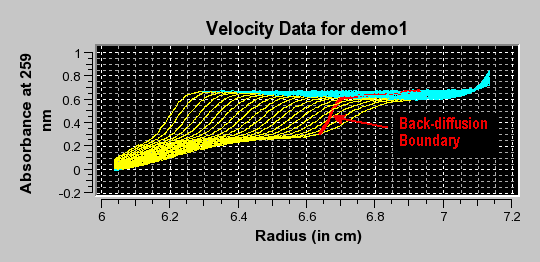
The first step in the analysis requires that you load an UltraScan dataset that has previously been edited with the UltraScan editing module. UltraScan sedimentation velocity datasets always have the suffix ".us.v". Click on the "Load Dataset" button in the left upper corner of the control panel. Simply select the desired run from the selection of available runs in the dataset loading dialog. Once loaded, the Run Details will be shown. Click on the "Accept" or "Cancel" button, and you will be returned to the analysis window, which will show the first available dataset of the selected run in the edited data window on the lower right panel, and the enhanced van Holde - Weischet analysis will be shown in the upper right panel of the analysis window.

Analysis Functions:

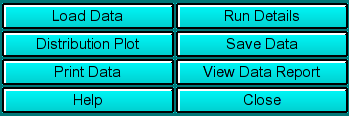
Click on these buttons to control the enhanced van Holde - Weischet analysis.
  • Load Data: Load edited data sets (with the *.us suffix). A file dialogue will allow you to select a previously edited and saved velocity experiment. If the data was edited with an older version of UltraScan than the current, an error message will be displayed.
  • Run Details: View the diagnostic details for a particular run.
  • Distribution Plot: View the van Holde - Weischet integral distribution plot for the current analysis.
  • Save Data: Write out a copy of all results to an ASCII formatted data file suitable for import into a spreadsheet plotting program. See "File Structures and Formats" for details.
    Note 1: These files are overwritten each time this button is clicked. Only the last version of the analysis will be saved!
    Note 2: If groups have been defined, a finite element model will also be saved, which can be imported into the finite element analysis to initialize a finite element fit.
  • Print Data: Load the printer control panel for printing of plot graphics
  • View Data Report: See the data report for the last analysis setting. Note: This file is re-written each time it is accessed. Only the current analysis result is available.
  • Help: This help file
  • Close: Close the van Holde - Weischet analysis window.

Run Information:

  • Run ID: The name of the run given during editing
  • Temperature: The average temperature calculated from the entire run
  • Available Cells: The numbers the cells that contain analyzable data
Clicking on a cell and wavelength selection will bring up the cell contents description for that cell and wavelength. Scroll through this list to bring up information for cells > 3. If there is no data available for the selected cell, the program will list "No Data available". Selecting a cell/wavelength combination will automatically bring up the corresponding dataset and present the analysis.

Experimental Parameters:

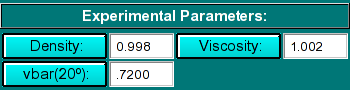
Here you can enter the corrections for density, viscosity, and partial specific volume of your sample. As you change the information in these fields, the program will automatically update the analysis to correct the S-value according to the specified buffer conditions. If the data was retrieved from the database and associated with the correct buffer file and peptide file, the density, viscosity and partial specific volume (vbar) will automatically be updated to the appropriate values and don't need to be adjusted to produce S 20,W corrected values.
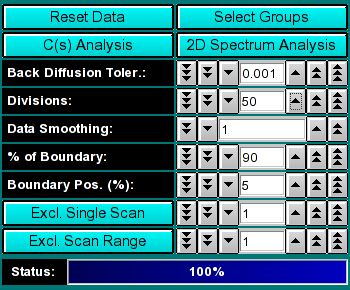
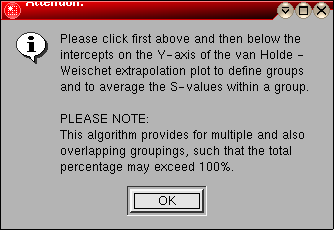
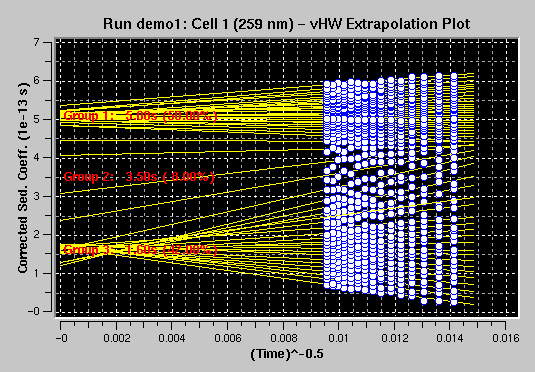
  • Density: Click to calculate the density based on the composition of your buffer.
  • Viscosity: Click to calculate the viscosity based on the composition of your buffer.
  • vbar(20o): Click to calculate the partial specific volume for a peptide based on its primary amino acid sequence and correct the vbar value for the current temperature.

Analysis Controls:
  • Reset Data - use this button to reset the default settings for the analysis.
  • Select Groups - use this button to define groups of S-value intercepts. After clicking on this button you'll see a short instruction dialogue asking you to click above and below a group of lines that intercept close to the same point in the extrapolation point. The corrected S-values belonging to these lines will be averaged and the average value as well as the percentage of the total lines (representative of the partial concentration of the component sedimenting with that S-value) will be displayed in the plot area and printed to the data report. The partial concentrations and S-values from each defined group will also be written to a model file that can be imported into the finite element analysis modules and serve as starting guesses for the finite element fits.
  • C(s) Analysis: Clicking on this button will launch the C(s) analysis using the currently available limits from the van Holde - Weischet analysis as an initialization for the C(s) analysis. The program will add 20% of the range at the top and the bottom of the current s-value distribution and set the initializations of the C(s) analysis accordingly.
  • 2D Spectrum Analysis: Clicking on this button will launch the 2-dimensional spectrum analysis using the currently available limits from the van Holde - Weischet analysis as an initialization for the spectrum analysis. The program will add 20% of the range at the top and the bottom of the current s-value distribution and set the initializations of the spectrum analysis accordingly.
  • Back-Diffusion Tolerance: The back-diffusion tolerance setting controls the concentration level at which back-diffusion is considered to be significant. A small value indicates a small concentration, resulting in a larger back-diffusion radius, while a higher tolerance setting results in a smaller back-diffusion radius, or higher tolerance for back-diffusion effects. This setting should be adjusted large enough to provide a maximum number of datapoints to be included in the linear extrapolation fit, but small enough such that the later scans provide apparent sedimentation coefficients consistent with the earlier scans. If the later scans yield S-values that are too low, the tolerance is set to high. Usually the default value is appropriate for standard noise levels in the data. The back-diffusion boundary is visualized by a red line in the "Edited Data Plot"
  • Divisions: The integral divisions used to create the van Holde - Weischet extrapolation plot. This is an integral number between 10 and 100. Changing this number will immediately recalculate the van Holde - Weischet plot and display the plot with the selected number of divisions. The larger this number, the higher the resolution of the analysis. Generally, the more datapoints there are across the boundary, the higher this number can be without introducing excessive noise.
  • Data Smoothing: Use this feature to smooth the experimental data. For noisy data, increasing this parameter can improve the clarity and appearance of the results considerably. Please note: Whenever possible, especially for very steep boundaries with low diffusion, try to avoid using too much smoothing to prevent artificial modification of the boundary shape. Smoothing is performed based on a frame average. The number shown represents the size of the smoothing kernel used (the number of datapoints averaged for a single point). The algorithm used is non-destructive of the original data and hence the smoothing is reversible. Also, point smoothing is independent, where the smoothing of one point does not have any effect on the smoothing of its neighbors. Only unsmoothened points are used for the calculation of the smoothed value. Each time you click on the counter, the current dataset will be reset to the full dataset.
  • % of Boundary: This is the portion of the boundary used for the analysis. 100 % refers to the entire boundary, reaching from the baseline concentration value to the plateau concentration value. This portion is shown in yellow in the experimental data plot at the lower right panel of the van Holde - Weischet analysis window. Excluded data is shown in blue. Changing this number will automatically reset the position of the analyzable portion of the boundary in the center of concentration between the baseline and the plateau concentration.
  • Boundary Position (%): For percent-boundary values less than 100 %, this number refers to the percentage of total concentration by which the remainder (=un-analyzed portion of the boundary) is shifted away from the baseline. A value of 0% refers to a data analysis start at the baseline. This number is always less than or equal to 100 % - (% of Boundary). It allows you to control the position of the analyzed portion relative to the baseline. The blue colored portion of a scan is excluded from the analysis, and the yellow portion is analyzed.
  • Exlude Single Scan: When setting this counter to a non-zero value, the respective scan will be highlighted in red. Clicking on "Excl. Single Scan" while a scan is highlighted in red will delete this scan from the analysis. Deleting scans from the analysis is irreversible and can only be reset by clicking on the "Reset" button or by reloading the data (when smoothing, the data is always automatically reloaded, causing the number of scans to be reset to the original count). Skipped scans are excluded automatically. Scans that are selected for exclusion are also marked with a vertical bar in the analysis plot, so you can easily identify which scan is about to be deleted.
  • Exclude Scan Range: Same as "Exclude Single Scan", except for multiple scans. To use this feature, select first the start scan of the range by using "Exclude Single Scan", then complete the scan range by using "Exclude Scan Range". Please see the van Holde - Weischet analysis tutorial to decide which scans are appropriate for analysis and which scans need to be excluded.
  • Status: The status bar informs the user about the progress of the analysis. On slower computers this has more significance than on a fast Unix machine.


www contact: Borries Demeler

This document is part of the UltraScan Software Documentation distribution.
Copyright © notice.

The latest version of this document can always be found at:

    http://www.ultrascan.uthscsa.edu

Last modified on July 17, 2005.