
|
|
Manual |
The QWT C++ plotting library, on which UltraScan is based, and which is distributed with UltraScan, provides a powerful feature for editing all plot properties such as line and symbol type, color, size, etc. as well as plot layout, title and label fonts, and the axis properties. To invoke the plot configuration for any plot generated under UltraScan, simply right-click on the plot frame. This will open up the main plot customization panel:
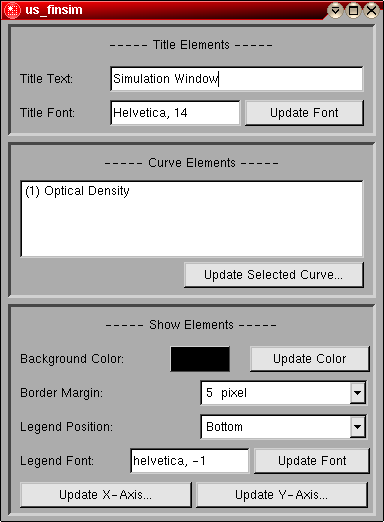
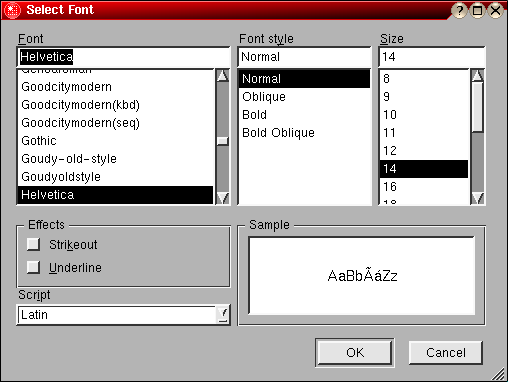
In the window entitled "Title Elements" you can modify the text of the plot title and change the font using the font selection panel. The next window is entitled "Curve Elements" and will list all curves displayed in the current plot. The curves are displayed by their name and number of appearance in the plot. You can simply click on the curve you want to change or select multipl curves (if multiple curves are displayed) to change all to the same properties. After selecting the desired curves, click on "Update Selected Curve..." to change the curve(s) properties. You will then be presented with the curve property control panel:
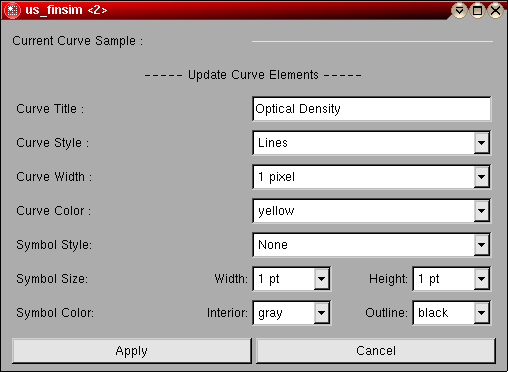
Select the desired curve properties from the drop-down lists, which include several predefined options, as well as the "Customize" option, which lets you set custom selections for colors. You can also edit the curve's description. Please not that different curves may have the same description, which may be best avoided to prevent confusion.
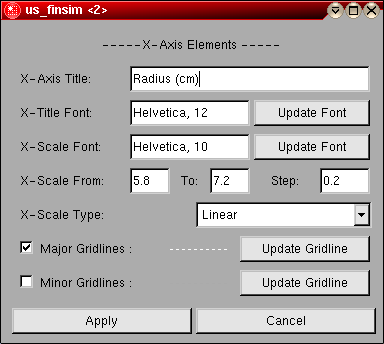
Last, you can modify the plot elements such as background color, margin, legend position and font, as well as axis properties. The axis properties are shown in the axis control panel:
This document is part of the UltraScan Software Documentation
distribution.
Copyright © notice.
The latest version of this document can always be found at:
Last modified on January 12, 2003.